 | The instructions in this article relate to Dashboard. The icon may be located on your StrataMax or GLMax Desktop or found using the StrataMax or GLMax Search. |
The Dashboard uses key data sources and offers a quick view of important information for a single building or the whole portfolio, with the functionality to drill down to view source data.
A company view is also available to provide an overview of portfolios, won and lost buildings / lots and a breakdown of income.
StrataMax Data Dashboard Overview
The Dashboard is able to be setup based on key data sources and other variables such as number of days, to ensure it provides the quick overview required for the efficient management of a portfolio, with the functionality to drill down to view source data that will include the coloured background based on the setup.


In order to refresh the Dashboard items, select another building from the Building Selector drop-down menu on the StrataMax desktop, then select the previous building again.
Dashboard Video
Data Sources | BCMax
Data from the following areas can be configured in StrataMax to display on the desktop or within the Dashboard icon. If a Dashboard icon is greyed out / cannot be accessed, this means the user does not have the appropriate security permission allowed; the required security permission is listed below in brackets where applicable.
To see Data Sources available in GLMax, see the GLMax Data Sources section below.
- Arrears Budget Percentage - Provides the percentage of arrears outstanding compared to the budget for the income accounts set for levies. Other arrears, overdue interest, and part-paid levies are not included in the percentage calculation. GST registered buildings that use a 'Net' reporting style will add GST to the total budget amount for reporting.
- Bank Rec not Processed or Unbalanced (Security permission: Bank Reconciliation Report).
- Buildings Not Rolled.
- Buildings with Unsaved BAS.
- Contract Registry Expiry - This can be filtered by Contract Category.
- Data Health - StrataMax is able to configure various data tables to automatically delete or archive data. Refer to our configuration and setup information on the Data Maintenance article.
- No. Days Oldest Payment Remains Unpresented (Security permission: Bank Reconciliation Report). Can be configured to display cheque payments only, and only unprinted.
- Days Until Insurance Due to Expire (Security permission: Insurance Info Extract).
- Days Until Struck Levy Due (Security permission: Levy Balance Control Report).
- Invalid SCM Bank Accounts – Alert on any buildings with SCM Accounts that do not exist in SCM for the drive.
- Levies Not Printed (Security permission: Levy Balance Control Report).
- Management Fee Expiry - Observes the Termination Date in management fee items in Management Fees Setup; this can be filtered by Invoice Code.
- Maturing Investment Accounts, which applies to investment bank accounts, offers the 'Days before maturity' field, observing the Maturity Date field in Bank Account Setup or in the Process Bank Statements | Other Investment Accounts screen.
- No. Days Oldest Payment Remains Unpresented.
- No. Days Oldest Receipt Remains Unpresented (Security permission: Bank Reconciliation Report).
- Pending Bank Account Changes.
- Pending Tasks - observes any tasks in Task Management that are not in a status of 'Completed'.
- Quotes - Outstanding or Unreceived (Security permission: Access to TaskMax).
- Roll Unprocessed Submissions - The tile will show any unprocessed Roll Submissions when selected. The data can also be exported to Excel.
- SCM Accounts not added to StrataMax - Reports any SCM accounts not set up in a building in Bank Account Setup.
- Strata Hub AGM Report - Monitors whether or not data has been uploaded to Strata Hub within 3 months of the last AGM. It will display buildings where reporting has exceeded the configured limits since last AGM date.
- Searches available in StrataMax can also be added to a user's Dashboard.
- Total Active Lot Count - Observes the 'Number of Lots (Standard)' field in Building Information.
- Work Orders - Unfinalised. Observes the date in the Finish field in the job. If the date is in the past and the job status has not progressed to E-Finalised it will be counted (Security permission: Access to TaskMax).
The title of each report can be modified to best describe the data set, and multiple versions of reports can be added. For example, a chart can be added to show how many days a payment has remained in the Bank Reconciliation not yet presented; this can be configured to include the entire portfolio, and for a single building.
Displays Types
There are four Display Type options for StrataMax Reports; Traffic Light, Single Number, Radial Gauge, and Radial Gauge Low High.
Traffic Light
The Traffic Light display allows a Lower Limit Value and an Upper Limit Value to be entered:
- The red warning light displays if the set number of items or days for the lower limit is exceeded.
- The yellow attention light displays if the set number of items or days is between the lower and upper limits.
- The green light displays if the upper limit is adhered to.
If multiple buildings are set up for the Dashboard item, the display will be based on the building with the lowest limit, and the icon can be clicked to view the source data, which will also be coloured based on the limit's setup.

Single Number
The Single Number display allows a lower and upper limit value to be entered. The number will be coloured based on the limits:
- The red warning number displays if the set number of items or days for the lower limit is exceeded.
- The yellow attention number displays if the set number of items or days is between the lower and upper limits.
- The green number displays if the upper limit is adhered to.
The display will be based on the building with the building with the lowest limit, and the icon can be clicked to view the source data, which will also be coloured based on the limits setup.

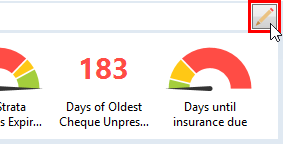
Radial Gauge
The Radical Gauge display allows a Lower Limit Value and an Upper Limit Value to be entered. The needle will point on the gauge based on the number of items or days of the source data and the range of days entered as the limits. The gauge will also display a number which will be based on the lowest limit building, and the icon can be clicked on to view the source data that will also be coloured based on the limits setup.
Radial Gauge Low High
The Radial Gauge Low High display allows a Minimum Value, Lower Limit Value, Upper Limit Value, and a Maximum Value to be entered. The needle will point to the red portion of the gauge if the set number of items or days for the minimum limit is exceeded or is below the Lower Limit. The needle will point to the yellow portion of the gauge if the set number of items or days is between the lower and upper limits, and a green if the upper limit is adhered to. If multiple buildings are setup for the Dashboard item, the display will be based on the lowest limit building, and the icon can be clicked on to view the source data that will also be coloured based on the limits setup.

Setting Up BCMax Dashboard Items
This section provides all the required steps to set up a Dashboard Item.
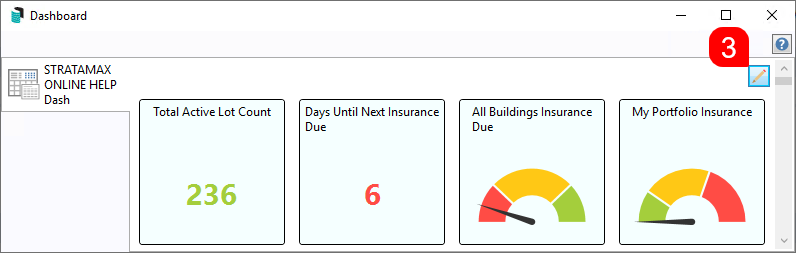
- When adding Dashboard Items to an existing Desktop Group, click the Desktop Group's Pencil button in the top right instead and go to step 4 below. If you are setting up a new Dashboard group, you must open the Dashboard menu by clicking its icon on the StrataMax or GLMax desktop, or using the Search field in the top left of the BCMax or GLMax desktop.
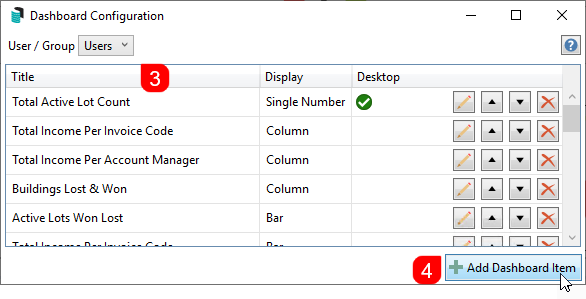
- When opened, any existing Dashboard Items will be displayed.
- Click the Pencil icon to open the setup.
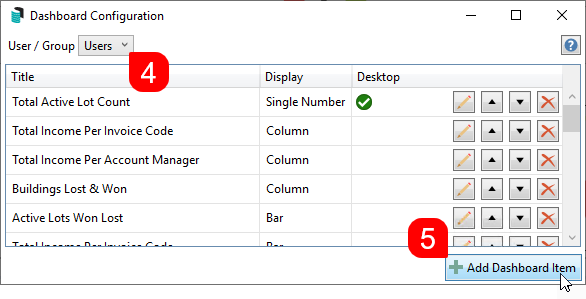
- Click the User / Groups drop-down to select which user or user group the Dashboard Item will be available for.
- Depending on which user or group is selected, the list of existing Dashboard Items will change.
- Click the Add Dashboard Item button.
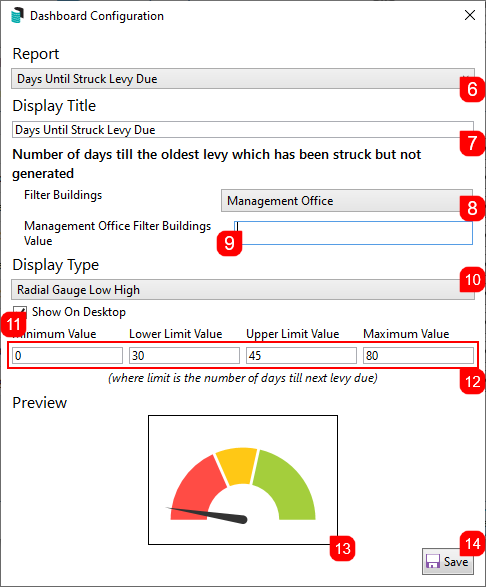
- The Dashboard Item's configuration window will appear. Click the Report drop-down menu to select the source data.
- Click in the Display Title field and change the title if required.
- Select from Filtered Buildings to display 'All Active Buildings', 'My Buildings (Account Manager)' or 'Current Building' or 'Management Office'.
- 'My Buildings (Account Manager)' relies on the user name in Security Setup matching the user name entered in Account Manager Edit for the Account Manager.
- Additional Filters may appear when particular data sources are used. Management Fee Expiry will allow a single Invoice Code number to be entered in 'Filter Invoice Code', if no Invoice Code is entered the results will be based on all Invoice Codes. Contract Register Expiry will allow a single Contract Category to be entered, if no Contract Category is entered the results will be based on all Contract Register categories.
- The Management Office Filter Buildings field is used when the Filter Buildings drop-down is set to 'Management Office'. This field observes the Management Office field in the Building Information, so check there for the possible values, then type in the required Management Office.
- Select the Display Type drop-down menu.
- Tick to Show on Desktop if required and set any other relevant configuration options; if not ticked to display on the Desktop, the icon will only display when the Dashboard icon is clicked on.
- Enter the required values (Minimum, Lower, etc.).
- Check that the Preview looks the way required.
- Click the Save button, and the Dashboard Item will be added to the list for that user or group.
- Further Dashboard Items can be added, or close the Dashboard, and if the Show on Desktop checkbox was ticked, the Dashboard Item will automatically appear either:
- A new Desktop Group called 'Dashboard for *user or group name*'
or - In an existing Desktop Group for the user name or group selected in step 4 above.
- A new Desktop Group called 'Dashboard for *user or group name*'


Delete Dashboard Item
This section explains how to remove a Dashboard item.
- When deleting a Dashboard Item from an existing Desktop Group, click the Desktop Group's Pencil button in the top right.

- In the 'Dashboard Confirguration' window, click the Delete button (red cross) on the Dashboard item you want to delete.


Drill Down
All Dashboard Items can be clicked to reveal their source data. Any data that is within the limits will be highlighted with a colour based on the setup. Results can be exported to Excel by clicking on the Excel icon in the top right.

Troubleshooting
Days Until Struck Levy Due will identify levies if they were not generated or not marked as generated as part of the new building setup process. These levies should be investigated to determine if they should have been generated, and if not, if the levy should be marked as generated using the Prior Manager option in Levy Management if appropriate.
Work Orders - Unfinalised will identify work orders if they have not been finalised based on the 'Finish' date in the dates section of the work order. If the finish date is left blank, the work order will never display on the dashboard results.
GLMax Data Dashboard Overview
The Dashboard in GLMax has been designed to display data from various sources in charts. The Dashboard in GLMax will also include Dashboard Items from StrataMax if they have been set up for the user. Open the Dashboard from within GLMax by clicking the Dashboard icon, or by searching for it using the Search field in the top left of the GLMax desktop.
Because GLMax data is displayed in charts, Dashboard Items for GLMax data cannot be displayed on the GLMax Desktop.
GLMax income data used for Total Income Per Account Manager and Total Income Per Invoice Code includes both active and inactive buildings for the current financial year of GLMax.

GLMax Data Sources
Data for the following can be configured to display within the Dashboard in GLMax.
- Active Lots - Won / Lost.
- Total Income Per Account Manager (Active Buildings and GLMax Current year only).
- Total Income Per Invoice Code (Active Buildings and GLMax Current year only).
- Data Health - To facilitate review and configuration of building data file retention including Building files, Documents, Documents (Lost), Emails, and Logs.
Chart Options

Setting Up GLMax Dashboard Items
Setting up Dashboard Items in GLMax is exactly the same as setting them up in StrataMax (BCMax), with a few changes to the options available. Each of the three sections below explains the steps for their respective data sources.
Total Income Per Account Manager
The total income per account manager will report income from the current financial year, based on who the account manager is at the time.
- Access GLMax and open the Dashboard, and any existing Dashboard Items will be displayed, including those in StrataMax.
- Click the Pencil icon in the top right to open the setup.
- Click the User / Groups drop-down to select which user or user group the Dashboard Item will be available for.
- Depending on which user or group is selected, the list of existing Dashboard Items will change.
- Click the Add Dashboard Item button.
- The Dashboard Item's configuration window will appear. Click the Report drop-down menu to select Total Income Per Account Manager.
- Click in the Display Title field and change the title if required.
- Enter a Maximum Account Managers to Show; the chart will display the maximum if set in descending order.
- Select the Display Type drop-down menu to choose a chart.
- Tick the relevant chart settings to change the way the chart will display.
- Check that the Preview looks the way required.
- Click the Save button, and the Dashboard Item will be added to the list for that user or group.


Active Lots - Won & Lost
The Won buildings will be calculated based on the field 'Taken on Date' that is located in Building Information, while Lost buildings will be calculated based on the data entered into the Lost Building Information.
- Access GLMax and open the Dashboard, and any existing Dashboard Items will be displayed, including those in StrataMax.
- Click the Pencil icon in the top right to open the setup.
- Click the User / Groups drop-down to select which user or user group the Dashboard Item will be available for.
- Depending on which user or group is selected, the list of existing Dashboard Items will change.
- Click the Add Dashboard Item button.
- The Dashboard Item's configuration window will appear. Click the Report drop-down menu to select Active Lots - Won/Lost.
- Click in the Display Title field and change the title if required.
- Select whether to report based on Lots, Buildings, or Income.
- A Dashboard Item can be set up for each of these options separately; i.e. one to display and report Lots, one for Buildings, and one for Income. Income is based on what is set up in Management Fees Setup.
- Select the drop-down menu to choose if the data should be displayed Monthly or Annually.
- Enter the number of intervals; for example, enter "12" to display 12 months.
- Select the Display Type drop-down menu to choose a chart.
- Tick the relevant chart settings to change the way the chart will display.
- Check that the Preview looks the way required.
- Click the Save button, and the Dashboard Item will be added to the list for that user or group.

Total Income by Invoice Code
The total income by invoice code will report income from the current financial year.
- Access GLMax and open the Dashboard, and any existing Dashboard Items will be displayed, including those in StrataMax.
- Click the Pencil icon in the top right to open the setup.
- Click the User / Groups drop-down to select which user or user group the Dashboard Item will be available for.
- Depending on which user or group is selected, the list of existing Dashboard Items will change.
- Click the Add Dashboard Item button.
- The Dashboard Item's configuration window will appear. Click the Report drop-down menu to select Total Income Per Invoice Code.
- Click in the Display Title field and change the title if required.
- Enter Maximum Invoice Codes to Show; the chart will display the maximum if set in descending order.
- Select the Display Type drop-down menu to choose a chart.
- Tick the relevant chart settings to change the way the chart will display.
- Check that the Preview looks the way required.
- Click the Save button, and the Dashboard Item will be added to the list for that user or group.

